


A graphic depiction of the impact of biofuels and oil prices on food prices.
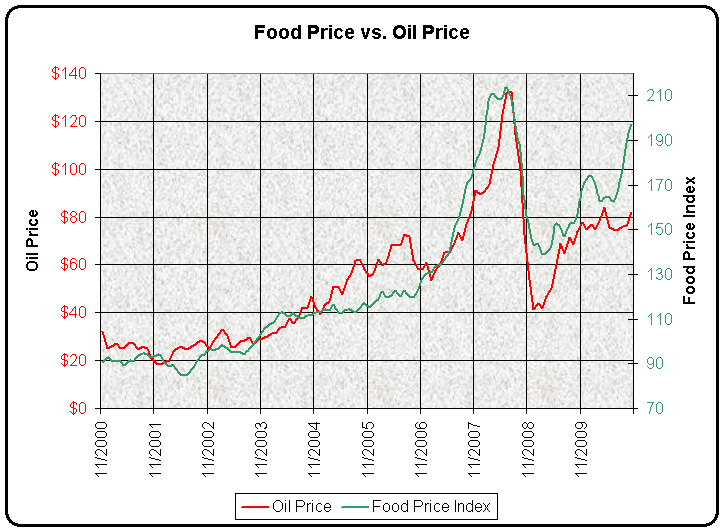
Graph was prepared by Paul Chefurka.
A graphic depiction of the impact of biofuels and oil prices on food prices.
Graph was prepared by Paul Chefurka.
Decoupling at right could indeed just be “blip” in non-linear progression, or may reflect increasing commodities futures speculation. The latter is estimated to account for up to 1/2 of rising staples price. Oil is of course driven by speculation as well, but commodities seems to be wall-street “darling” of late.
The fact that the graph on the right hand side seems to indicate an uncoupling of food an oil prices is most interesting. It seems counter intuitive as we know how dependent on fossil fuels the production of food is in modern economies.
It’s difficult to say what this chart means. Does it show, for example, how the world’s systems of food production and distribution are almost entirely dependent on fossil fuels?
Chefurka himself doesn’t mention biofuels; do the stats he used for “monthly average oil price” actually include the price of biofuels? Do biofuel prices fluctuate in the same way as oil prices do, or are they so heavily subsidized by public funds that their price is artificially stabilized in a way that oil prices are not?
Also there appears at the present time (the extreme right hand end of the graph) to be an unprecedented (for this decade, anyway) disconnection between food prices and oil prices; is this just a blip in the correlation, or is it the sign of a new trend?